| Clipping in a Bi-amped
System: These
pictures say a lot!
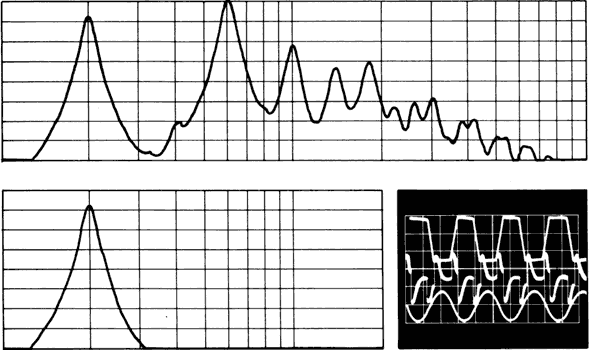
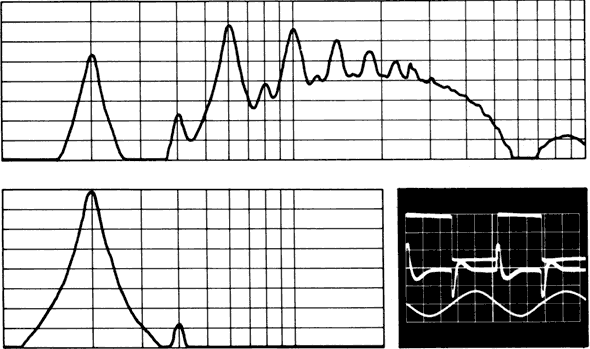
* Figure 15-24: Effects of over-driving amplifier |
|
|
|
(A) Spectra of single-amplifier (upper) and biamplified (lower) systems 6 dB into clipping at 200 Hz.
|
|
|
|
(B) Spectra of single-amplifier (upper) and biamplified (lower) systems 12 dB into clipping at 200 Hz.
|
| * Sound System Engineering, Second Edition, Don & Carolyn Davis, Focal Press, ISBN 0-240-80305-1, pg 408 |
|
|
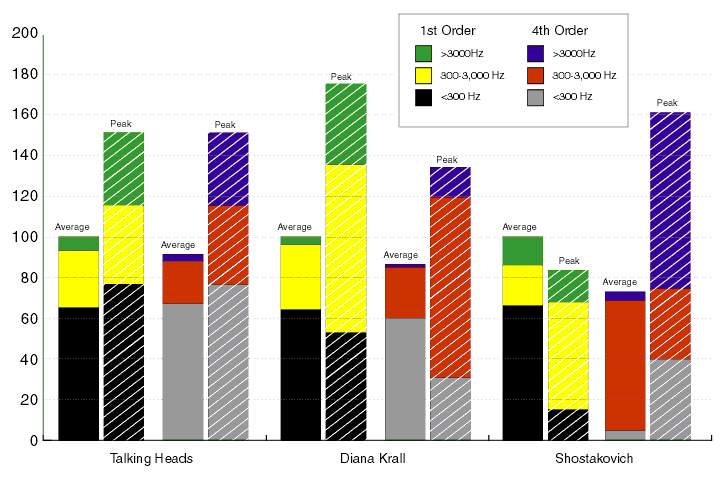
| Charts of Art Ludwig's
Multi-Amp Power Distribution Tables
|
|||||||||||||||||||||||||||||||||||||||||||||||||||||||||||||||||||||||||||||||||||||||||||||||||||||||||||||||||||||||||||||||||||||||
|
|
|||||||||||||||||||||||||||||||||||||||||||||||||||||||||||||||||||||||||||||||||||||||||||||||||||||||||||||||||||||||||||||||||||||||
|
|
|||||||||||||||||||||||||||||||||||||||||||||||||||||||||||||||||||||||||||||||||||||||||||||||||||||||||||||||||||||||||||||||||||||||


