| A Bipolar Transmission
Line Project -- the TLB
Section 3: System Radiation Response |
||
|
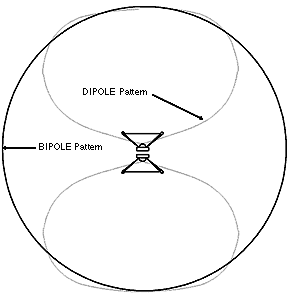
Fig. 3.0 TLB Radiation Pattern |
The two Vifa P13 drivers
are mounted in an push-push arrangement and driven in parallel, in phase. This results
in a 4 pi steradian polar pattern that is detailed in Fig. 3.1. In effect this results
in a point source radiation pattern from 50 Hz up to about 2-3 kHz. The dipole pattern results in phase cancellation at 90° and the conventional wisdom is that this is desirable since it reduces the side wall bounce. However the Haas reverberant field data shows that the side wall reflections, if they are in the 20 ms range, enhance the spacial definition. A comparison with the monopole radiation pattern was done. While a dipole comparison would have been desirable, it will have to await the completion of a seperate study. |
|
| Polar Response Data | ||
|
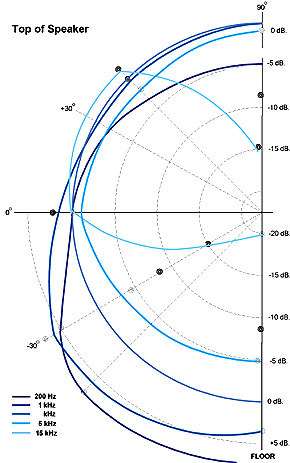
Fig. 3.2 Vertical TLB pattern |
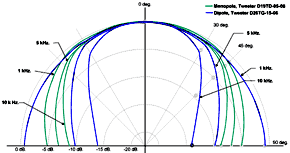
Horizontal response A frontal hemisphere is shown in Fig.3.1, but the back hemisphere is the same with the difference that the back tweeter is not time aligned. The polar response from 60 Hz to about 2 kHz is circular and begins to narrow to a 30° bipole pattern @ 10 kHz. The interesting observation is that the HF pattern is wider in the monopole configuration. The monopole data is green/bipole data is blue. click images for larger picture |
Fig. 3.1 Horizontal TLB patterns |
| Vertical response The vertical response of the TLB is more complex. The LF response up to about 200 Hz shows the effect of the TL terminus gain and the floor coupling of about +6dB. For the HF the pattern gradually narrows and is shifted to about a +30° axis upward and narrowing to approximately a 40° lobe. Since these measurements were very difficult to do, only the frontal pattern was characterized. |
||
|
Impedance Data To gain an understanding of the characteristics of the TLB it is necessary to understand the nominal TL's impedance characteristics. |
||
|
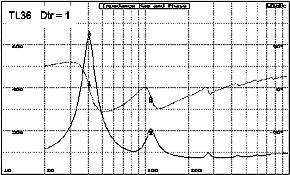
Fig. 3.3 TL36 0.9144 meter line unstuffed line |
Impedance for Dtr=1,unstuffed line, note that mrk#1 is at driver Fs and that mrk#2 corresponds to TL line Fr, fundamental resonance displaced by phase shift. Note the presence of line harmonics which are attenuated as the stuffing density is increased from the air's density 0.0745 lbs/cu ft. ie Dtr=1. | |
|
Fig. 3.4 TL36 0.9144 meter line under stuffed line |
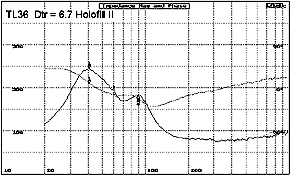
Impedance for Dtr=6.7 Dacron HoloFill fiber. Packing density would fall between the fiberglass and the wool reference curves as given by Bradbury. Note that Fs peak is reduced but more importantly that the Fr peak has shifted in frequency downward. This is the effect of the change in the air velocity in the fiber. Note also the flattening of the phase curve | |
|
Fig. 3.5 TL36 0.9144 meter line optimally stuffed line |
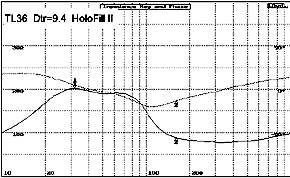
Impedance for Dtr=9.4.
Note that the Fs and Fr peaks are almost equal. This can be
used as an approximation of optimum stuffing density for the specific line. The actual
value would be dependent on the driver slope attenuation at Fr. A higher
value would permit overstuffing the line thus maximizing the attenuation of the harmonics. For a monopole TL the optimum Dt impedance peak is about 20 ohms. |
|
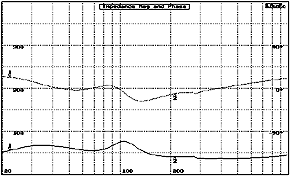
| The TLB push-push
woofer loads a TL line length of 0.944 meters. Note that the impedance is almost
flat at 5 ohms and that the phase data is equally good. In contrast to the monopole
TL configuration the impedance is reduced from about 20 ohm peak to a minimal energy
storage. The consequences of this can be examined in the pulse response simulations of the closed box vs that of the vented box. The closed box analogy is justified by the TL's near field response which is equal to that of the critically damped closed box. |
Fig. 3.6 TLB Impedance Data |
|
|
[ Contents | Introduction | Methodology | Radiation Response | Transient Response | Frequency Response | Construction ]
|
||
