| A Bipolar Transmission
Line Project -- the TLB
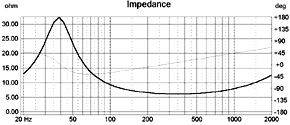
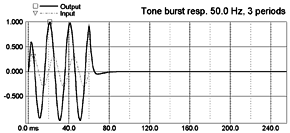
click images for larger picture Section 4: Transient Response Simulation An insight into the transient response of the system can be gained by considering the system response of a gated sine for a vented vs a Qtc =0.707 sealed system. The woofer's loading by a TL is equivalent to a response of Qtc=0.5. This correspondence will be documented in the system response data section. |
||
|
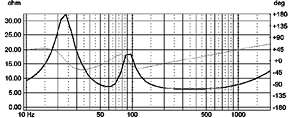
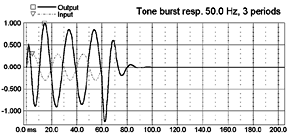
Transient response for closed box. Qtc=0.50 Fig. 4.0 Closed box Impedance Qtc =0.50 Fig. 4.1 Closed box Transient Response Qtc =0.50 |
Transient response for closed box. Qtc=0.707 Fig. 4.2 Closed box Impedance Qtc =0.707 Fig. 4.3 Closed box Transient Response Qtc =0.707 |
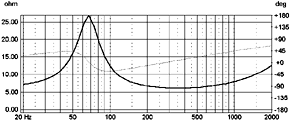
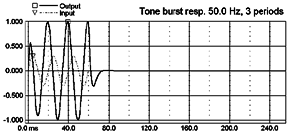
Transient response for the vented box Fig. 4.4 Vented box Impedance Fig. 4.5 Vented box Transient Response |
|
|
Note that the falling
edge has a minimal overshoot and has settled in less than a cycle
|
Note that the falling
edge has a very high negative overshoot and requires over 1 and 1/2
cycles (approximately 30 ms) to settle.
|
| While a comparable simulation for the TL can't be readily done, the comparison of the impedance data suggest that the TL will have a better transient response and provides some understanding of why the very linear impedance of the TLB data is important. This is ascertained in the subjective aural tests of the monopole vs the bipole TL configurations. I hope that this examination provides some hard data to buttress the subjective impressions of the importance of transient response. | ||
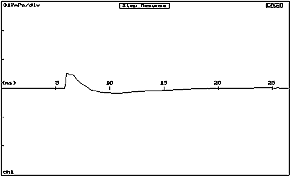
| An alternative way of
examining the systems response is by a step impulse. This shows the time alignment of the woofer's and tweeter's response and gives an indication of the time coherence and thus the imaging capabilities of the system. The rising edge is the tweeter's response and the second bump indicates the woofer's response. This is a very good pulse reproduction by the speaker. |
Fig. 4.6 TLB step function response |
|
|
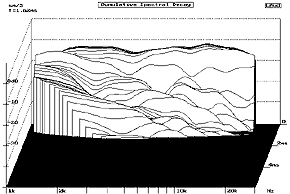
Fig. 4.7 TLB CSD response |
The third way to judge
the systems response is to examine the Cumulative Spectral Decay plot. Since the CSD plot is 1 meter in room response, the decay characteristics are consistent with the TLB design of 4 pi steradian reflected sound. The decay is very gradual in the lower frequencies indicating that a very complex reverberant field has been achieved. Note that the CSD shows a smooth decay without any resonance ridge characteristics. The tweeter and woofers merge is also very smooth justifying the minimal CR design. |
|
|
[ Contents | Introduction | Methodology | Radiation Response | Transient Response | Frequency Response | Construction ]
|
||
