| A Bipolar Transmission
Line Project -- the TLB
Section 5 System Frequency Response |
||||
|
The TL's system response (1 meter response), is defined by the near field woofer's response summed with the TL's terminus near field response. At FR the TL's resonance frequency, this summation is a vector addition since the phase of the woofer differs from the phase of the terminus by about 90° at optimum Dtr. The near field woofer's response is a product of the drivers T/S parameters as loaded by the impedance of the TL line. As previously shown the impedance changes as the line is stuffed. Also the statement was made that the TL's woofer's response is equivalent to that of the critically damped closed box response, ie Qtc =0.5. |
||||
| This equivalency can be
used to model the expected response of a specific driver in a TL by examining the
drivers response for a Qtc=0.5 by simply increasing the VB
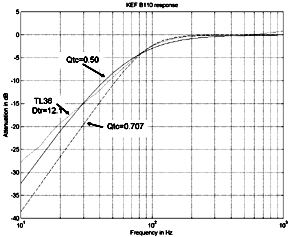
for a closed box. The fig. 5.0 graph shows the modeled response for a KEF B110 for a closed box, Qtc=0.707, dashed line and a critically damped Qtc=0.50 system, solid line and the measured response for the driver in a TL=0.944 meter line, dotted line.In a general case the TL near field response is equivalent to the criticaly damped closed box response, i.e. Qtc = 0.50. From this data we can extrapolate that the driver is theoretically suited for a Fr~40Hz. or a TL length ~ 2 meters. Achieving the theoretical is skill and fiber characteristics dependent |
Fig. 5.0 TL near field vs. closed box Qtc=0.50 response click image for larger picture |
|||
|
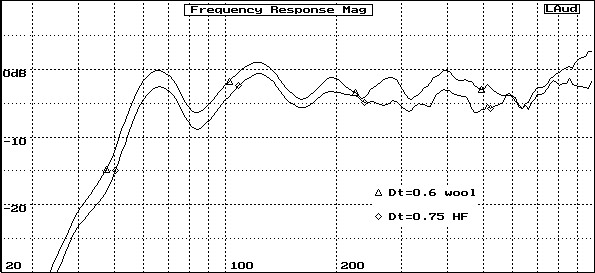
Fig. 5.1 TL 1 meter system response
|
Fig. 5.1 shows the optimum
stuffed line, TLB system response, for wool fiber and for Dacron Holofill
II fiber. Note that the Dt values are different for the two fiber types.
A brief characterization of fiber type dependency will be given later. For the moment
I'll give a short explanation of the data for Fig. 5.1. The peak @ 65 Hz is TL line length dependent and the following null is related to the 1st harmonic, the second peak is 2nd. harmonic related and the 2nd null is 3rd harmonic related. The relative amplitude of these is defined by the line stuffing density Dt and is fiber type dependent. The frequency position of these harmonics will also shift due to the fiber effect of the change of speed of sound in the line. The design relationship is quite complex. For instance, if the drivers Fs is lower then it might be possible to overstuff the line and thus reduce the null amplitude. |
|||
| Since the TLB uses two drivers in an push-push configuration the line is pressurized quite differently from that of a standard TL and the Dt value has to be adjusted. The effect is illustrated in Fig. 5.2. The top curve is for the push-push response and the bottom for a single driver with the same Dt value. This illustrates in a rough way the change in TL system response as Dt is adjusted for optimum value. Note that while the null frequencies are fixed the peak values being dependent on the fiber attenuation characteristics, change in amplitude. |
Fig. 5.2 TLB Frequency Response vs. Dt value click image for larger picture |
|||
|
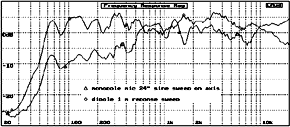
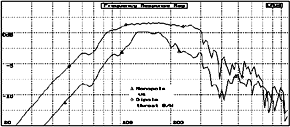
Fig. 5.3 TLB Frequency Response vs. Terminus Response click image for larger picture |
Fig. 5.3 is the comparison of the TL terminus response for the bipole, top curve and for the monopole with the same Dt value. The very interesting difference is the widening of the bandwidth for the push-push driver configuration. Also note that the magnitude of the bipole is about 10dB. higher than for the monopole. Changing the Dt value it would be possible to increase the Terminus gain for a monopole configuration so that the system response would be about the same. The TL36 configuration was used as a base line for the TLB, thus this is not a supposition. The bandwidth widening suggests that the bipole configuration would permit a drivers Fs somewhat higher since the effective Terminus bandwidth is wider than 3 octaves. | |||
| TL Line Stuffing Instructions The line is stuffed using long—haired wool @ a Dtr = 8.2 or Dt = 0.6 lbs/cu.ft. For TLB, this is equal to ~ 13.9 oz. The line stuffing should be homogenous and should be installed after the column damping panels have been installed and before the remaining side of the column is glued. The effects of the line stuffing have previously been discussed in the impedance data plot examples. However the major effects are shown in the TL's Terminus Response Data for Dtr and the accompanying frequency shifts of the harmonics and primarily of the phase @ Fr which defines the TL system response. |
||||
| TL Fiber Characteristics To understand the TL design and especially the TL non-linearity that takes place for a design where the line length is greater than about 1.5 meters, we have to understand fiber related effects on attenuation and the speed of sound change in the line. These factors are defined by the Bradbury fiber equations and here I can but give a very short summary since a fuller treatment is possible as solutions to the wave equations which define the attenuation and change in speed of sound in the fiber mass and are density related. |
Fig. 5.4 Fiber Attenuation Characteristics click image for larger picture |
Fig. 5.5 Fiber Change in Speed of Sound Characteristics click image for larger picture |
||
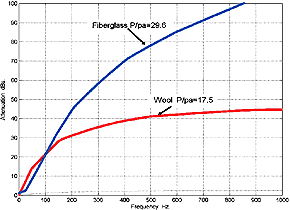
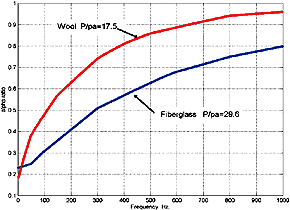
| Fig.5.4 and fig.5.5 show
the fiber related (fiberglass / wool) characteristics for attenuation and for change
of speed of sound in the fiber mass vs. frequency. If you examine fig.5.5 you'll
note that the fiberglass curve bottoms out @ about 50 Hz. This defines the non-linearity
region of the TL design. The wool curve is slightly better indicating that wool could
be used for ~ a 2 meter line, as was used by Bailey. Below 30 Hz a new type of fiber
must be found; Miraflex seems a likely candidate. However TL design for sub use is
very problematic. Fig. 5.6 shows the change in D c as a function of stuffing density Dt. It should be obvious that Dt value will vary with TL line length since higher values will be required to achieve the desired D c and thus the required phase shift at the terminus, consequently the TL system response magnitude @ Fr. This data graphically contradicts Dt formulas as used in Q&E TL Design. |
Fig. 5.6 Fiber Change in Speed of Sound Characteristics vs. Dt click image for larger picture |
|||
|
|
||||
|
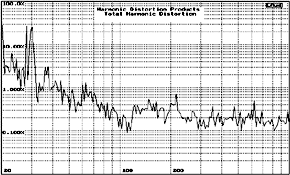
Fig. 5.7 TLB THD click image for larger picture |
Low Frequency THD characterization The graph shows the Harmonic distortion characteristics of the TLB. Note that the data has to be read from 60Hz the limit of the TL design. The 1% value indicates a very low value since comparable low frequency designs generally are at the 4% range. The THD is about 0.5% for the remaining range. The data shown is for the undamped TL case. |
|||
|
[ Contents | Introduction | Methodology | Radiation Response | Transient Response | Frequency Response | Construction ]
|
||||
