| A Phase Linear Transmission
Line Project
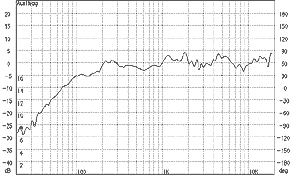
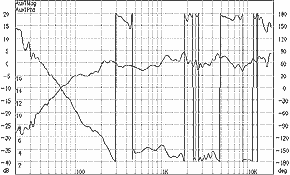
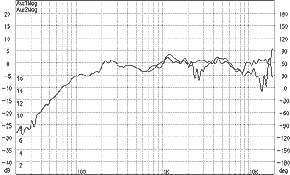
Section 2: Measurements Figure 2.1: Shows the complete system anechoic on-axis response. The LF response is tailored to fall off below 200Hz matching room gain. Figure 2.2: Shows the system response with the measured phase. The phase shift up to 300Hz is well behaved, above this the phase is essentially flat within ±15 degrees. |
||
|
Figure 2.1. System response. |
Figure 2.2. System response and phase |
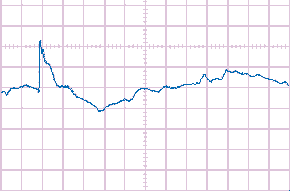
Figure 2.3. PLTL step response |
|
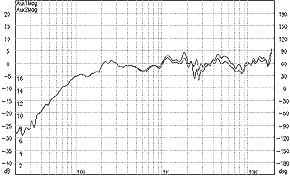
Figure 2.6. Right and left speaker |
Figure 2.7. On-axis and off-axis 30deg. |
Figure 2.6: Right
and left speaker 1.5 meteres comparison. Figure 2.7: Measurements at 1.5 meters at angles 0 and 30 degrees, showing the good horizontal coverage resulting from the low crossover frequency. |
|
[ Contents | Intro | Measurements | Optimization | Integration | Step Compensation | Time Align | Crossover | Construction ]
|
||
