|
A Phase Linear Transmission
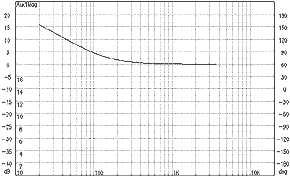
Line Project Section 4: Room integration Room gain is the LF gain that a normal listening room adds to the signal. The gain varies from room to room and with speaker placement. For a free standing speaker, it can look something like the graph in Figure 4.1. Authors like Ohman, Bacon, and Colloms have described low frequency alignments that would suit the listening room. The alignments differ according to the cut off frequency. High cut off frequencies requires a higher Q for the tonal balance to be neutral. Low cut offs favors lower Q. Room curves are very
similar to the output of a transmission line with the graduall rolloff. Several measurements
were taken for both speakers with increasing distance to the back wall. The listening
room of interest is particularly difficult being assymmetrical with a reflecting
wall on the left side and a open space on the right side. |
||
|
Figure 4.1. Room gain after Colloms. |
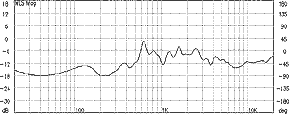
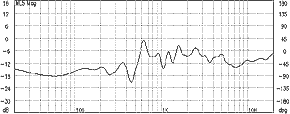
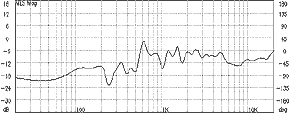
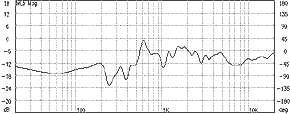
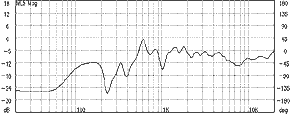
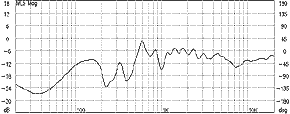
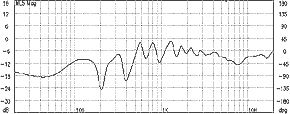
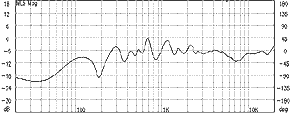
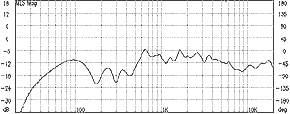
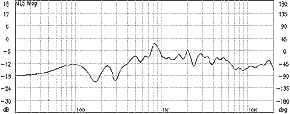
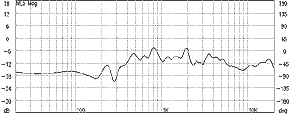
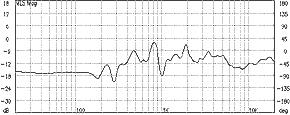
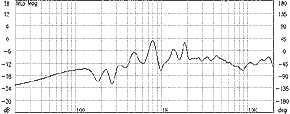
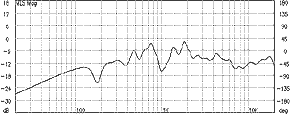
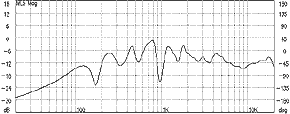
Figure 4.2-4.9 covers the right speaker Figure 4.10-4.14 covers the left speaker For the right speaker, placement is not very sensitive up to 30 cm from the wall. Distances from 40-70cm sucks out the low frequencies. Greater distances than 70cm still have good lf extension. |
Figure 4.2. Right speaker 0 cm from wall. |
|
Figure 4.3. Right speaker 10 cm from wall. |
Figure 4.4. Right speaker 20 cm from wall. |
Figure 4.5. Right speaker 30 cm from wall. |
|
Figure 4.6. Right speaker 40 cm from wall. |
Figure 4.7. Right speaker 50 cm from wall. |
Figure 4.8. Right speaker 70 cm from wall. |
|
Figure 4.9. Right speaker 100 cm from wall. |
|
|
|
|
||
| The left speaker is a
bit more difficult to place, being in a corner position. 20-30 cm from the back wall
gives the best result. Placing both speakers 20-30cm from the back wall seem to give the best results for the measured listening position in this living room. This agrees closely with listening observations. (The PLTL is intentionally optimized for a placement rather close to the wall. ) |
Figure 4.10. Left speaker 0 cm from wall. |
Figure 4.11. Left speaker 10 cm from wall. |
|
Figure 4.12. Left speaker 20 cm from wall. |
Figure 4.13. Left speaker 30 cm from wall. |
Figure 4.14. Left speaker 40 cm from wall. |
|
Figure 4.15. Left speaker 50 cm from wall. |
Figure 4.16. Left speaker 70 cm from wall. |
|
|
[ Contents | Intro | Measurements | Optimization | Integration | Step Compensation | Time Align | Construction ]
|
||
